Automatically create a ggplot for objects obtained from restrict_coef()
Source:R/model_refinement.R
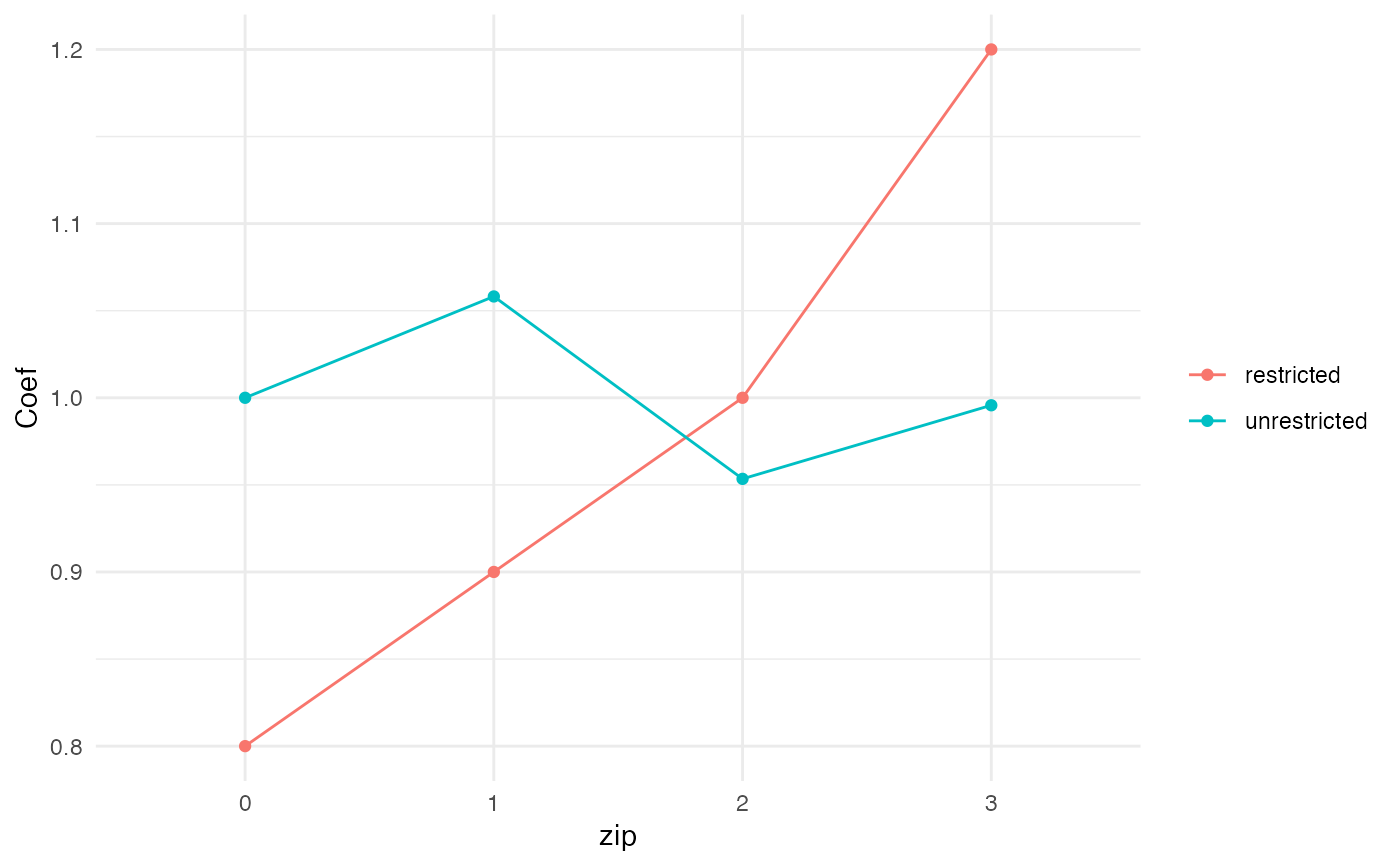
autoplot.restricted.Rd![[Experimental]](figures/lifecycle-experimental.svg) Takes an object produced by
Takes an object produced by restrict_coef(), and produces
a line plot with a comparison between the restricted coefficients and
estimated coefficients obtained from the model.
Usage
# S3 method for class 'restricted'
autoplot(object, ...)
Arguments
- object
object produced by
restrict_coef()- ...
other plotting parameters to affect the plot
Examples
freq <- glm(nclaims ~ bm + zip, weights = power, family = poisson(),
 data = MTPL)
zip_df <- data.frame(zip = c(0,1,2,3), zip_rst = c(0.8, 0.9, 1, 1.2))
freq |>
  restrict_coef(restrictions = zip_df) |>
  autoplot()