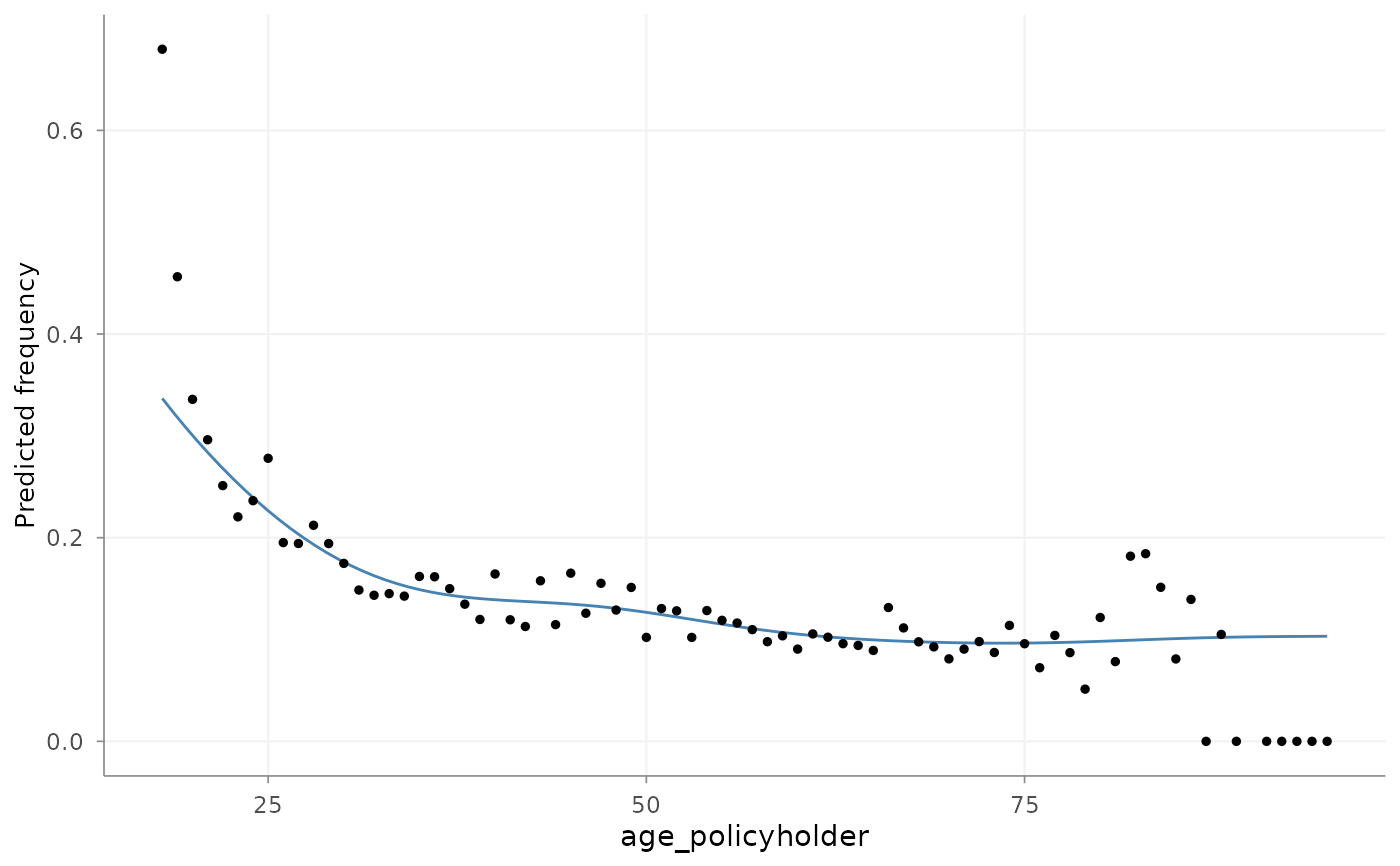
Estimate the relationship between a continuous risk factor and claim frequency, average severity or risk premium with a generalized additive model (GAM). The fitted curve is intended for exploratory risk-factor analysis before selecting a functional form, applying refinement or deriving categorical tariff segments.
Usage
risk_factor_gam(
  data,
  risk_factor = NULL,
  claim_count = NULL,
  exposure = NULL,
  claim_amount = NULL,
  pure_premium = NULL,
  model = "frequency",
  round_risk_factor = NULL,
  x = NULL,
  nclaims = NULL,
  amount = NULL,
  round_x = NULL
)
Arguments
- data
A data frame containing portfolio observations.
- risk_factor
Character string. Numeric continuous risk-factor column in
data.- claim_count
Character string. Claim-count column. Required for
model = "frequency"andmodel = "severity".- exposure
Character string. Exposure column used as an offset or aggregation weight.
- claim_amount
Optional character string. Total claim-amount column. Required for
model = "severity".Optional character string. Row-level risk-premium column. Required for
model = "pure_premium"and aggregated using exposure weights.- model
Character string. Response context:
"frequency","severity"or"pure_premium". The deprecated value"burning"maps to"pure_premium".- round_risk_factor
Optional positive numeric value. The continuous risk factor is rounded to multiples of this value before aggregation and model fitting. This can reduce computation and local volatility when the variable has many distinct values, but it also removes detail.
- x, nclaims, amount, round_x
Deprecated argument names. Use
risk_factor,claim_count,claim_amount, andround_risk_factorinstead.
Value
A list of class "risk_factor_gam" with compatibility classes
"riskfactor_gam" and "fitgam". It contains:
- prediction
Prediction grid with fitted values and pointwise confidence limits.
- x
Name of the continuous risk factor.
- model
Response context:
"frequency","severity"or"pure_premium".- data
Aggregated observed experience and fitted values at observed risk-factor values.
- x_obs
Risk-factor values in the original portfolio row order, after optional rounding.
- round_risk_factor
Rounding increment used for the risk factor, or
NULLwhen no rounding was applied.
Details
Statistical specification
"frequency"fits a Poisson GAM to aggregated claim counts withlog(exposure)as offset."severity"fits a Gamma GAM with log link to average claim amount. The response is total claim amount divided by claim count and claim count is used as model weight."pure_premium"fits a Gamma GAM with log link to exposure-weighted risk premium.
Observations are first aggregated by the risk-factor value after optional rounding. Predictions and pointwise confidence intervals are then evaluated over the observed range.
Actuarial interpretation
The fitted curve describes the marginal pattern in the selected portfolio data. It can reveal non-linearity, broad turning points and areas with sparse support, but it is not by itself a final tariff structure. Correlation with other risk factors, exposure concentration, claim volume, tail observations and stability across periods should be considered before using the pattern in a multivariate GLM.
autoplot.riskfactor_gam() can be used to inspect the curve and observed
experience. derive_tariff_segments() can subsequently translate the smooth
pattern into candidate intervals. Alternatively, add_smoothing() supports
smoothing within the structured refinement workflow.
Column interface and compatibility
Column names are supplied as character strings. Deprecated fit_gam() and
riskfactor_gam() interfaces remain available for compatibility.
References
Antonio, K. and Valdez, E. A. (2012). Statistical concepts of a priori and a posteriori risk classification in insurance. Advances in Statistical Analysis, 96(2):187–224.
Henckaerts, R., Antonio, K., Clijsters, M. and Verbelen, R. (2018). A data driven binning strategy for the construction of insurance tariff classes. Scandinavian Actuarial Journal, 2018:8, 681–705.
Wood, S.N. (2011). Fast stable restricted maximum likelihood and marginal likelihood estimation of semiparametric generalized linear models. Journal of the Royal Statistical Society (B) 73(1):3–36.
Examples
age_frequency <- risk_factor_gam(
  MTPL,
  risk_factor = "age_policyholder",
  claim_count = "nclaims",
  exposure = "exposure",
  model = "frequency"
)

autoplot(age_frequency, show_observations = TRUE)