Add portfolio experience to a rating table
Source:R/model_rating_table.R
add_portfolio_experience.Rdadd_portfolio_experience() enriches a rating_table() object with observed
portfolio experience. When data is supplied, observed experience is
calculated automatically for all risk factors in the rating table, unless
risk_factors is specified. Existing factor_analysis() results can also be
supplied through observed.
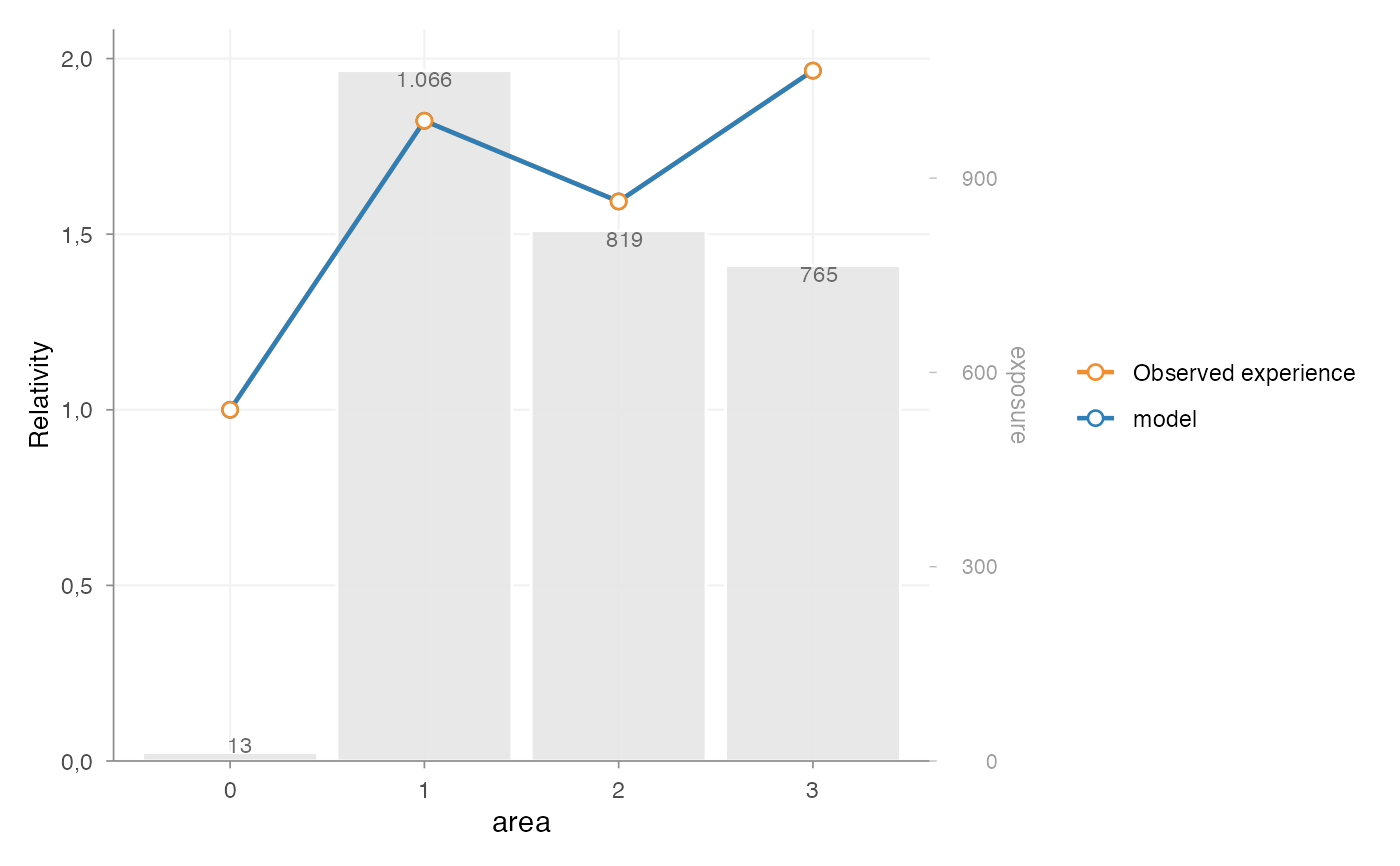
This makes it possible to compare fitted GLM relativities with observed
portfolio patterns in autoplot.rating_table(). The full observed output is
stored on the rating table, so autoplot.rating_table() can later switch
between metrics such as "frequency", "average_severity" and
"risk_premium" without recalculating the summaries.
The observed metric is scaled before plotting. With scale = "reference"
the metric is divided by the observed value of the model reference level. If
a clear reference level cannot be found, the metric is scaled to its mean.
With scale = "mean", the metric is always scaled to its mean.
Usage
add_portfolio_experience(x, ...)

# S3 method for class 'rating_table'
add_portfolio_experience(
  x,
  observed = NULL,
  data = NULL,
  risk_factors = NULL,
  claim_count = NULL,
  exposure = NULL,
  claim_amount = NULL,
  metric = NULL,
  label = "Observed experience",
  color = NULL,
  scale = c("reference", "mean"),
  experience = NULL,
  ...
)
Arguments
- x
A
rating_tableobject returned byrating_table().- ...
Unused.
- observed
Optional
factor_analysis()object or list offactor_analysis()objects. If supplied, these observed summaries are attached directly.- data
Optional
data.frame. Ifobserved = NULL, observed experience is calculated from this data.- risk_factors
Optional character vector. Risk factors for which observed experience should be calculated. If
NULL, all risk factors in the rating table are used.- claim_count
Optional character string. Claim count column used by
factor_analysis().- exposure
Optional character string. Exposure column used by
factor_analysis().- claim_amount
Optional character string. Claim amount column used by
factor_analysis().- metric
Optional character string. Default observed metric to plot. Common choices are
"frequency","severity"/"average_severity"and"risk_premium". The metric can also be overridden inautoplot.rating_table().- label
Character; legend label for the observed experience line.
- color
Optional line color. If
NULL, the internal risk premium color is used.- scale
Character; scaling applied before plotting. One of
"reference"or"mean".- experience
Deprecated alias for
observed.
Examples
df <- MTPL2
df$area <- as.factor(df$area)

model <- glm(
  nclaims ~ area + offset(log(exposure)),
  family = poisson(),
  data = df
)

rating_table(model, model_data = df, exposure = "exposure") |>
  add_portfolio_experience(
    data = df,
    claim_count = "nclaims",
    exposure = "exposure"
  ) |>
  autoplot(risk_factors = "area", metric = "frequency")


observed <- factor_analysis(
  df,
  risk_factors = "area",
  claim_count = "nclaims",
  exposure = "exposure"
)

rating_table(model, model_data = df, exposure = "exposure") |>
  add_portfolio_experience(observed = observed) |>
  autoplot(risk_factors = "area")
observed <- factor_analysis(
df,
risk_factors = "area",
claim_count = "nclaims",
exposure = "exposure"
)
rating_table(model, model_data = df, exposure = "exposure") |>
add_portfolio_experience(observed = observed) |>
autoplot(risk_factors = "area")
