
insurancerating provides actuarial tools and building blocks for traditional insurance pricing workflows. GLMs remain at the core, with supporting functions for portfolio analysis, risk-factor structuring, model interpretation, tariff refinement, validation, large-loss treatment and scalable data preparation.
The package works alongside standard R modelling tools such as glm(). Models are fitted with familiar R functions and can subsequently be analysed, interpreted, refined and validated in actuarial terms with insurancerating. The building blocks can be used independently or combined according to the portfolio and pricing question.
The package is developed independently as a generally applicable actuarial R package. Its examples illustrate possible combinations of the building blocks; they are not a universal industry workflow or a description of the pricing methodology or governance process of any particular organisation.
Installation
Install the CRAN version, or install the development version from GitHub:
install.packages("insurancerating")

# install.packages("remotes")
remotes::install_github("MHaringa/insurancerating")
Explore portfolio experience
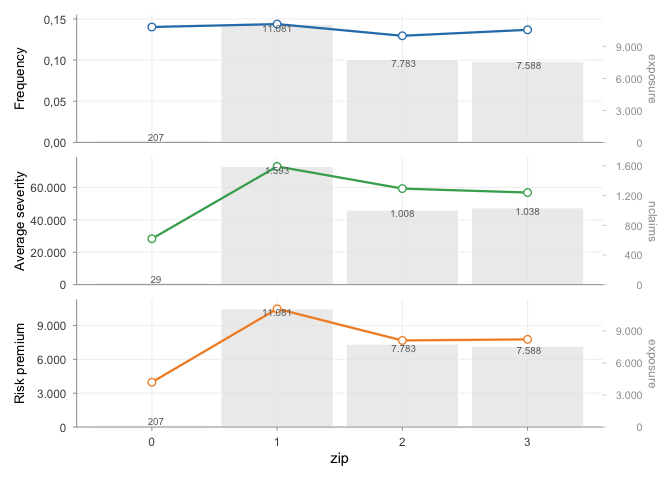
factor_analysis() summarises observed experience and the exposure supporting each level of a rating factor. These unadjusted portfolio patterns are useful before modelling, but should not be interpreted as conditional tariff relativities.
library(insurancerating)

portfolio <- as.data.frame(MTPL)
portfolio$zip <- factor(portfolio$zip)

zip_analysis <- factor_analysis(
  portfolio,
  risk_factors = "zip",
  claim_count = "nclaims",
  exposure = "exposure",
  claim_amount = "amount"
)

autoplot(
  zip_analysis,
  metrics = c("frequency", "average_severity", "risk_premium")
)
From model to refined tariff
A standard Poisson GLM can be translated into an explicit tariff adjustment before it is refitted. The restriction below is deliberately small: it shows the refinement architecture without replacing the specialist documentation.
frequency_model <- glm(
  nclaims ~ zip + offset(log(exposure)),
  family = poisson(),
  data = portfolio
)

zip_restrictions <- data.frame(
  zip = c("0", "1", "2", "3"),
  zip_restricted = c(0.90, 0.95, 1.00, 1.10)
)

refined_model <- frequency_model |>
  prepare_refinement(data = portfolio) |>
  add_restriction(zip_restrictions) |>
  refit()

rating_table(refined_model, exposure = FALSE)
## risk_factor level est_refined_model
## 1 (Intercept) (Intercept) 0.136653
## 2 zip_restricted 0 0.900000
## 3 zip_restricted 1 0.950000
## 4 zip_restricted 2 1.000000
## 5 zip_restricted 3 1.100000The refinement steps remain explicit and reviewable. Their actuarial rationale and effect on the portfolio should still be assessed before implementation.
What does insurancerating help with?
| Pricing task | Main tools |
|---|---|
| Explore portfolio experience |
factor_analysis(), outlier_histogram()
|
| Structure continuous risk factors |
risk_factor_gam(), derive_tariff_segments()
|
| Interpret fitted model effects |
rating_table(), add_portfolio_experience()
|
| Refine tariff structures |
prepare_refinement(), add_smoothing(), add_restriction(), refit()
|
| Validate fitted models |
model_performance(), check_overdispersion(), check_residuals(), bootstrap_performance()
|
| Treat large losses |
assess_excess_threshold(), redistribute_excess_loss()
|
| Reduce portfolio data locally |
rating_grid(), merge_date_ranges()
|
| Reduce portfolios in a database |
rating_grid_db(), merge_date_ranges_db()
|
Where should I start?
Getting Started Follow one portfolio through risk-factor analysis, modelling, technical risk premium, interpretation, validation and refinement.
Pricing workflow and package building blocks See how the main actuarial pricing tasks and package components fit together.
Refinement building blocks Translate estimated model effects into an explicit, reviewable and implementable tariff structure.
Model validation Assess statistical adequacy, resampling stability, tariff plausibility and observed portfolio behaviour.
Large Portfolios Reduce production-sized portfolios with model-point aggregation and database-backed workflows.
Project information
- Package website
- CRAN package
- Issue tracker
- Citation information is available with
citation("insurancerating"). - The package is distributed under the GPL (>= 2) licence.