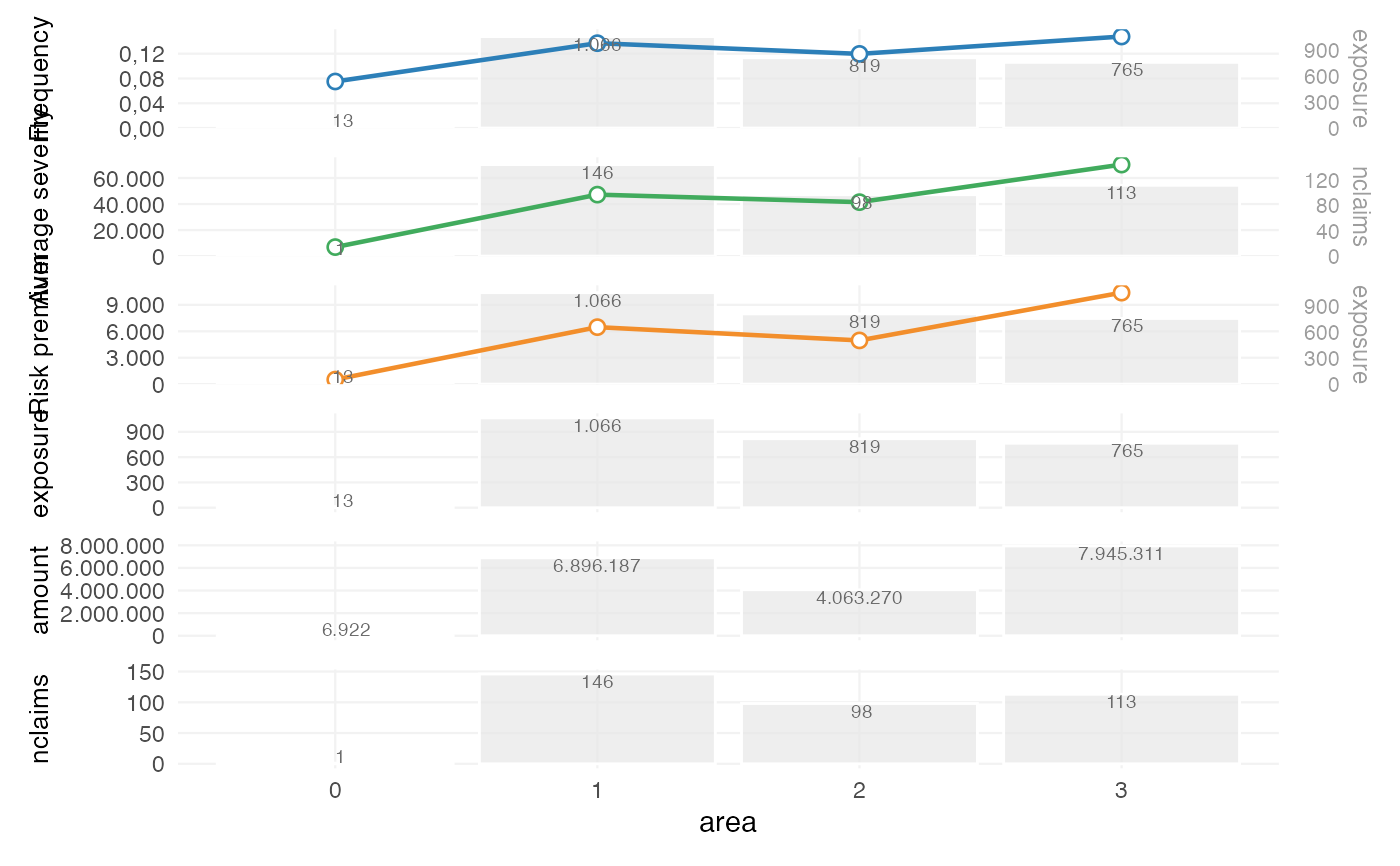
Plot observed portfolio experience by risk factor
Source:R/univariate.R
autoplot.factor_analysis.RdVisualise the exposure and observed actuarial metrics calculated by
factor_analysis(). The plots support assessment of portfolio composition,
observed frequency, severity, risk premium and loss ratio across risk-factor
levels.
The observed patterns are descriptive. They do not adjust for correlations with other risk factors and should therefore not be interpreted as multivariate tariff relativities.
Usage
# S3 method for class 'factor_analysis'
autoplot(
  object,
  metrics = NULL,
  ncol = 1,
  legend_position = c("right", "bottom", "top", "left", "none"),
  show_exposure = TRUE,
  show_exposure_labels = TRUE,
  sort_by_exposure = FALSE,
  level_order = NULL,
  decimal_mark = ",",
  line_color = NULL,
  bar_fill = NULL,
  abbreviate_labels = TRUE,
  label_width = 20,
  label_abbreviations = NULL,
  flip_bars = FALSE,
  show_total = FALSE,
  total_color = NULL,
  total_name = NULL,
  rotate_angle = NULL,
  custom_theme = NULL,
  remove_underscores = FALSE,
  compact_x_axis = TRUE,
  show_plots = NULL,
  background = NULL,
  labels = NULL,
  sort = NULL,
  sort_manual = NULL,
  dec.mark = NULL,
  color = NULL,
  color_bg = NULL,
  coord_flip = NULL,
  remove_x_elements = NULL,
  ...
)
Arguments
- object
A
factor_analysisorunivariateobject produced byfactor_analysis()orunivariate().- metrics
Numeric or character vector specifying which metrics to plot (default is all available metrics). The numeric positions are:
1. Frequency (
nclaims / exposure)2. Average severity (
claim_amount / claim_count)3. Risk premium (
claim_amount / exposure)4. Loss ratio (
claim_amount / premium)5. Average premium (
premium / exposure)6. Exposure
7. Severity
8. Number of claims
9. Premium
Character values can be
"frequency","average_severity","risk_premium","loss_ratio","average_premium","exposure","claim_amount","claim_count", and"premium".- ncol
Positive whole number. Number of columns in the plot composition.
- legend_position
Character string specifying the legend position. Supported values are
"right","bottom","top","left"and"none". A legend is present only when thefactor_analysisobject was created withgroup_by, because the resulting group-specific series are distinguished by colour. Withoutgroup_by, colours are fixed plot styles and no legend is drawn; in that case this argument has no visible effect.- show_exposure
Show exposure as background bars behind line plots (default = TRUE).
- show_exposure_labels
Show labels with the exposure bars (default = TRUE).
- sort_by_exposure
Sort risk factor levels into descending order by exposure (default = FALSE).
- level_order
Custom order for risk factor levels; character vector (default = NULL).
- decimal_mark
Decimal mark; defaults to
",".- line_color
Optional override for line/point color. If NULL (default), colors are taken from the internal palette. If specified, the chosen color is applied to all line-based plots.
- bar_fill
Optional override for background bar color. If NULL (default), the background color is taken from the internal palette. If specified, the chosen color is applied to all background bars.
- abbreviate_labels
Logical. If
TRUE, long risk-factor level labels are shortened tolabel_widthcharacters. A shortened label ends in one period; for example,"Bouwnijverheid"becomes"Bouwn."whenlabel_width = 6. Only the displayed axis labels are changed.- label_width
Positive whole number of at least 2. Maximum number of characters in automatically shortened level labels.
- label_abbreviations
Optional named character vector with explicit display labels, for example
c("Bouwnijverheid" = "Bouwn.", "Onroerend goed" = "Onr. goed"). Explicit labels take precedence over automatic shortening.- flip_bars
Logical. If
TRUE, flip cartesian coordinates for bar plots (metrics 6 to 9). This option does not affect the line-based plots for metrics 1 to 5.- show_total
Show line for total if
byis used (default = FALSE).- total_color
Color for total line (default =
"black").- total_name
Legend name for total line (default = NULL).
- rotate_angle
Numeric value for angle of labels on the x-axis (degrees).
- custom_theme
List with customized theme options.
- remove_underscores
Logical; remove underscores from labels (default = FALSE).
- compact_x_axis
Logical. When
TRUEandncol == 1, x-axis components are removed from all plots except the last one. The following elements are suppressed:axis.title.xaxis.text.xaxis.ticks.x
This prevents duplicated x-axes in vertically stacked patchwork plots. Defaults to
TRUE.- show_plots
Deprecated. Use
metricsinstead.- background
Deprecated alias for
show_exposure.- labels
Deprecated alias for
show_exposure_labels.- sort
Deprecated alias for
sort_by_exposure.- sort_manual
Deprecated alias for
level_order.- dec.mark
Deprecated alias for
decimal_mark.- color
Deprecated alias for
line_color.- color_bg
Deprecated alias for
bar_fill.- coord_flip
Deprecated alias for
flip_bars.- remove_x_elements
Deprecated alias for
compact_x_axis.- ...
Currently unused.
Details
For rate-based metrics, exposure can be shown as background bars so that observed level differences can be interpreted together with portfolio volume. Levels with little exposure or few claims can produce volatile observed metrics and should be assessed accordingly.
When the factor analysis contains one or more by variables, separate
observed series are shown. show_total = TRUE adds the aggregate portfolio
series for comparison. Sorting and manual level ordering affect only the
presentation; the underlying summaries are unchanged.
A rate or ratio is not shown for a risk-factor level when its denominator is
zero or missing. For example, average severity is undefined when claim count
is zero, and loss ratio is undefined when premium is zero. autoplot() gives
one combined warning identifying the affected metrics and levels. Other valid
metrics and exposure information remain in the figure.
Examples
# Plot observed frequency and risk premium
x <- factor_analysis(MTPL2,
                     x = "area",
                     severity = "amount",
                     nclaims = "nclaims",
                     exposure = "exposure")
#> Warning: The `x` argument of `factor_analysis()` is deprecated as of insurancerating
#> 0.9.0.
#> ℹ Please use the `risk_factors` argument instead.
#> ℹ The deprecated feature was likely used in the insurancerating package.
#>   Please report the issue at
#>   <https://github.com/MHaringa/insurancerating/issues>.
#> Warning: The `severity` argument of `factor_analysis()` is deprecated as of
#> insurancerating 0.9.0.
#> ℹ Please use the `claim_amount` argument instead.
#> ℹ The deprecated feature was likely used in the insurancerating package.
#>   Please report the issue at
#>   <https://github.com/MHaringa/insurancerating/issues>.
#> Warning: The `nclaims` argument of `factor_analysis()` is deprecated as of
#> insurancerating 0.9.0.
#> ℹ Please use the `claim_count` argument instead.
#> ℹ The deprecated feature was likely used in the insurancerating package.
#>   Please report the issue at
#>   <https://github.com/MHaringa/insurancerating/issues>.
autoplot(x, metrics = c("frequency", "risk_premium"))